|
Hi! It's been a little under a month since my last post about the markets and my foreword looking perspectives, and I thought it was time for an update. On a personal note, I am in the recovery stages of my first COVID infection. I successfully (luckily?) avoided the virus for 2+ years, didn't really suffer the vaccine hangovers that some did, etc, but apparently my number came up. I think I will be ok. We are currently waiting to see if I infected my family; it's been a couple of days and so far they seem to have escaped. And if you want a summary of what's below, this is a simplified version: the markets are in a funk, I know and don't like it any more than you do, and I think there's a chance it gets worse for a while. But ultimately, my clients and I are following an approach designed to weather the storm in pursuit of their financial goals. The longer version tilts to the "nerdy" and relies on a lot of charts. Interest ratesIt may be my past life as a bond trader informing my perspective, but I still see interest rates as the primary metric to watch for insights into the health of our economy and markets. First, I want to highlight some fairly straightforward relationships: 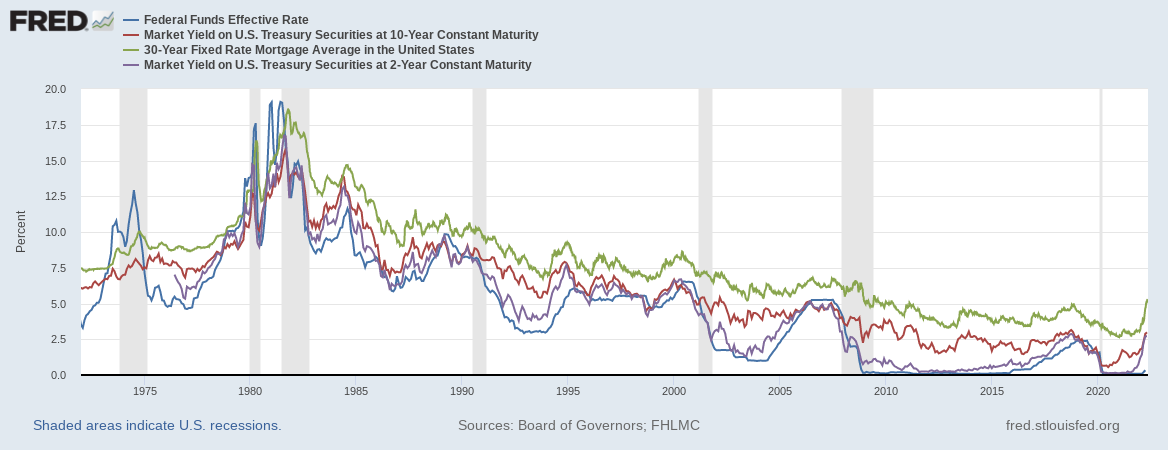 The Federal Reserve and the US Treasury are both meaningful actors in our economy, and their roles overlap. The Fed's toolbox has two main options: they can essentially set a floor on bank lending rates, and they can buy & sell bonds (historically mostly treasury bonds) in the market to influence market yields. The chart above shows the relationship between the "effective Fed Funds" rate and three others:
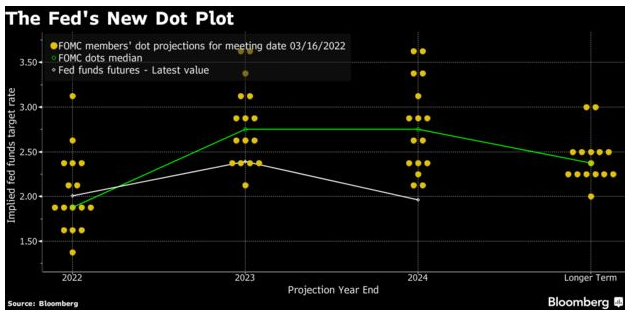 Without dwelling on this piece for too long, my main takeaways is that even the more aggressive members of the Fed see topping out around 3.5%. This could always evolve, but let's take as a current premise that they are correct for now. Flipping back to the comparison of the effective Fed Funds rate and the 10 year treasury: 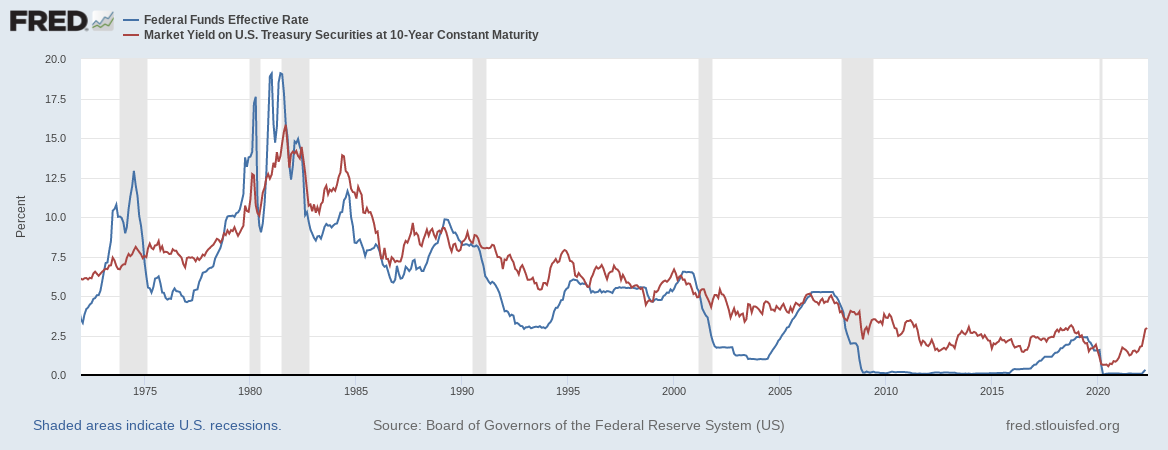 The treasury market is "out in front" of the Fed at the moment; the market pushed yields at this spot as high as 3.12% on May 6 before falling back to ~ 2.8% as of this morning. My current expectation is that the treasury market is going to trade sideways for a while, as the Fed "catches up", and absent additional inflationary surprises, I would expect the 10 year to end this cycle in the 3 - 4% range. (I don't profess to know, just guessing based on the historical pattern). Speaking of inflation, the market has an opinion about where we are headed: 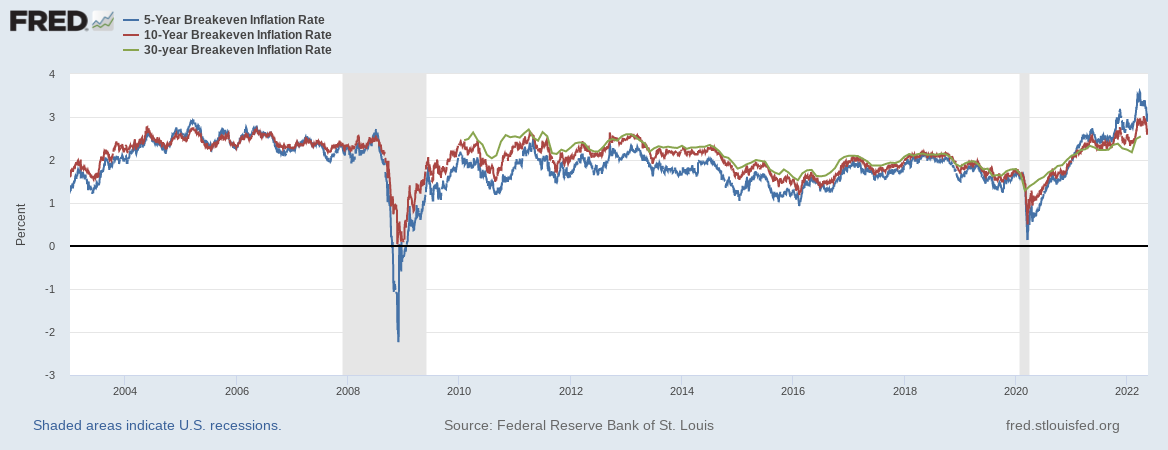 The US Treasury issues both "regular" and "inflation adjusted" bonds; at a given maturity, the difference in market yields between those two informs a so-called "breakeven" rate that we assume approximates inflation over that period. This seems to suggest the market things inflation over the next 5 to 10 years will average out to around 3 - 3.5% The image above shows the breakeven rates at the 5, 10, and 30 year spots. It is not unique over that history for the 5 year spot (shown here in blue) to exceed the 10 and 30 year spots, but the degree of excess in recent history is meaningful. Here it is zoomed into the last 12 months: 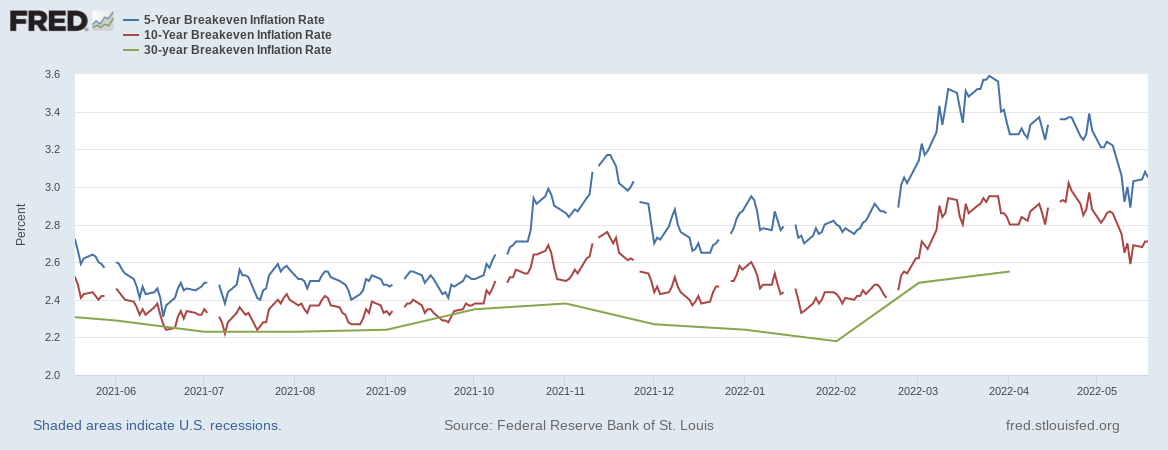 To me, this suggests that the bond market (currently) believes that inflation will top out and reverse course within the next 5 years, or quickly enough so as not to impact values as much over the 10 year span. All of this has implications for portfolios holding bonds or bond funds. Most of my clients do have allocations to bonds, and those positions took a major hit as interest rates rose. If interest rates continue to rise, the value of those positions will continue to fall...that is simply the nature of bond market pricing. However, bonds and bond funds distribute meaningful cash flows to investors that allow for tactical reinvestment, and if the thesis about rates going sideways for a while is correct, the worst may be over for high quality bonds. StocksLongtime clients and readers know that I have held concerns about stock market valuations since at least 2019. By the end of that year, and using the price to earnings multiple for the S&P 500 index, stocks were overvalued by as much as ~ 50%; using an alternate valuation version that "smooths" the earnings part of the metric over a 10 year period made it look even worse at about 80% overvalued. There were some structural changes to consider: the tax regime was very different coming out of 2018, and that resulted in a step-change in corporate profits that could potentially justify the growth in P/E. And then, after the COVID shutdowns hit the markets and stimulus efforts began, all bets were off. So many dollars hit the market and eventually found their way to risk assets (stocks, investment properties, cryptocurrencies...) that the S&P rose about 47% from the end of 2019 to the high point in December 2021. Even after the recent sell-off, the S&P is still about 20% higher than December 2019. Is this an interesting time to point out that the nominal compound annual growth rate of the S&P since 1871 is about 9.37%? Projecting stock market valuations is fraught; one may Google recent headlines from big banks like JPM Chase, Morgan Stanley, Bank of America and get a sample of where they see the S&P closing out 2022. My view has been that I won't be surprised if the index revisits levels seen at the end of 2019; that would represent another ~ 20% decline from current levels and approximately a ~ 40% decline from the highs. My concern around the market falling that far has actually lessened a bit in recent weeks, but ultimately my intention is not to try to time the markets, but to prepare for range of outcomes based on relative likelihood...which is a good segue: So what do you do?For myself and clients who ask me to manage their investments, my process is rooted in study and experience:
Stay safe out there. If you are a client, please feel free to reach out with questions about your investments and financial planning concerns. If you are not a client and find yourself interested in an advisory firm that takes the time to nerd out on occasion, feel free to fill out our contact form here: https://www.drwfinancial.com/contact.html This blog post is intended as market commentary and to be educational. It does not imply certain knowledge of where any market or index is headed. Past performance does not imply future performance.
Comments are closed.
|
AuthorDavid R Wattenbarger, president of DRW Financial Archives
June 2022
Categories |
 RSS Feed
