|
This post seeks to share some insight about the current state of the markets and economy, as well as some ideas on how to make the best of this moment. Volatility is here!As of this writing, on June 16, 2022, the S&P 500 is down about 24% from it's highest level, which was set on January 3 of this year. The 10 year US treasury yield is around 3.31%, which is more than double the level is traded at the start of the year. In the simplest terms, these two points taken together mean that almost any portfolio built of funds that track the stock and bond markets are likely to be "down" in value over the last ~ 6 months. Some broader context may be useful here. Considering the current level of the S&P and the level in mid June 2017, for roughly 5 years of data, the compound annual growth rate of the index is still around 8.4%, and that is excluding dividends. So an investor holding a broad basket of stocks over the last 5 years, annual returns have probably been decent, even with the current downturn. However, it is never fun to see portfolio values drop, and the current level of market volatility is something we have not seen in a while; the image below shows the level of the "VIX", one measure of market volatility, over the last 5 years: 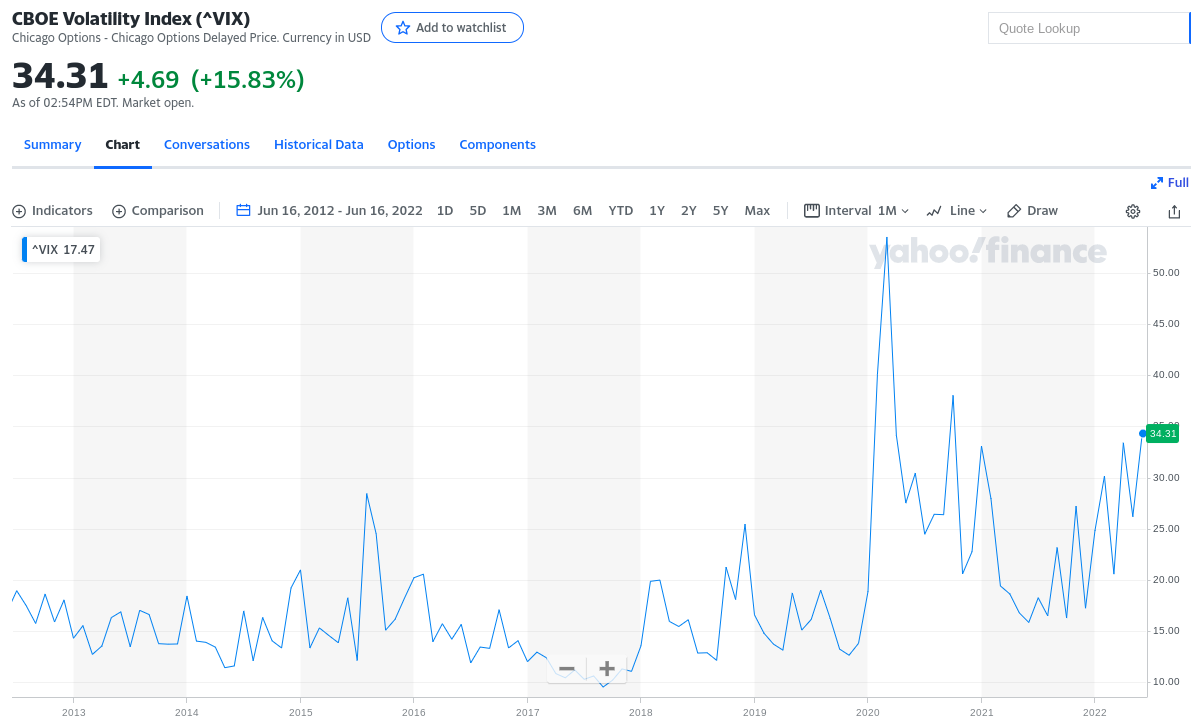 The tallest peak in that range was the March 2020 market crash at the outset of the COVID-19 disruptions, and the market is creeping back towards that level of volatility. Volatility in the markets is not necessarily bad, but it can be uncomfortable to watch. When things are going well, it is normal investor psychology to think that the markets are an intelligent machine, constantly calculating value, but my perspective has come to view the markets more like a drunk college freshman trying to find their way back to the dorm...they will probably get to the right place eventually, but will likely stumble and sway along the way. This is particularly the case in the short run, which is why my firm's approach to financial planning and investment attempts to match portfolio advice to the time horizon for a given goal. Young folks who are well employed and have decades to save for retirement are generally able to weather some bouts of market volatility along the way; people close to or in retirement may have circumstances that dictate they are less comfortable having as much exposure to that volatility. What's coming next?I continue to hold the line that the future is hard to see, and the best we can do is prepare based on the things we do know now.
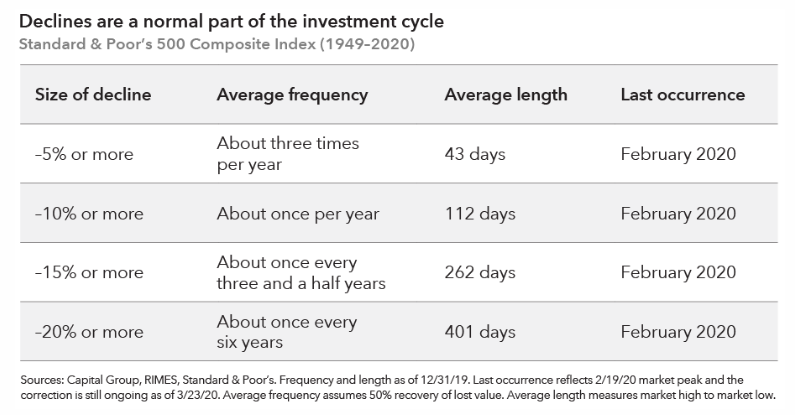
Market history does not necessarily imply or inform the market's future, but there are some things we can learn from the past:
Opportunities here?There are a handful of things that may make sense to consider in this market moment, and I welcome the opportunity to discuss these with my current and prospective clients one on one:
Hi! It's been a little under a month since my last post about the markets and my foreword looking perspectives, and I thought it was time for an update. On a personal note, I am in the recovery stages of my first COVID infection. I successfully (luckily?) avoided the virus for 2+ years, didn't really suffer the vaccine hangovers that some did, etc, but apparently my number came up. I think I will be ok. We are currently waiting to see if I infected my family; it's been a couple of days and so far they seem to have escaped. And if you want a summary of what's below, this is a simplified version: the markets are in a funk, I know and don't like it any more than you do, and I think there's a chance it gets worse for a while. But ultimately, my clients and I are following an approach designed to weather the storm in pursuit of their financial goals. The longer version tilts to the "nerdy" and relies on a lot of charts. Interest ratesIt may be my past life as a bond trader informing my perspective, but I still see interest rates as the primary metric to watch for insights into the health of our economy and markets. First, I want to highlight some fairly straightforward relationships: 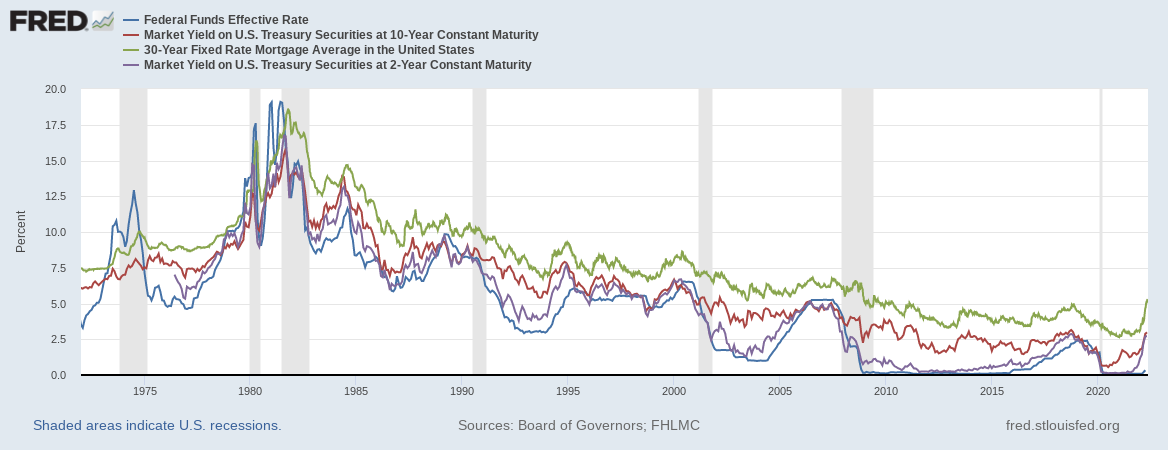 The Federal Reserve and the US Treasury are both meaningful actors in our economy, and their roles overlap. The Fed's toolbox has two main options: they can essentially set a floor on bank lending rates, and they can buy & sell bonds (historically mostly treasury bonds) in the market to influence market yields. The chart above shows the relationship between the "effective Fed Funds" rate and three others:
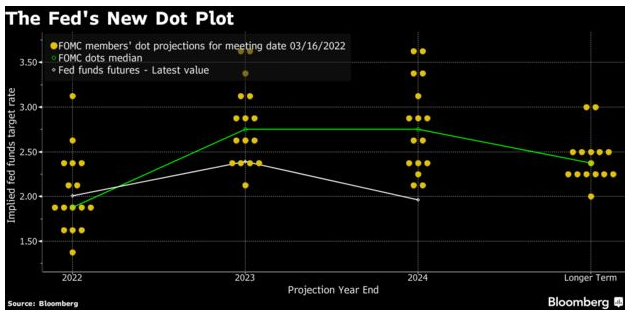 Without dwelling on this piece for too long, my main takeaways is that even the more aggressive members of the Fed see topping out around 3.5%. This could always evolve, but let's take as a current premise that they are correct for now. Flipping back to the comparison of the effective Fed Funds rate and the 10 year treasury: 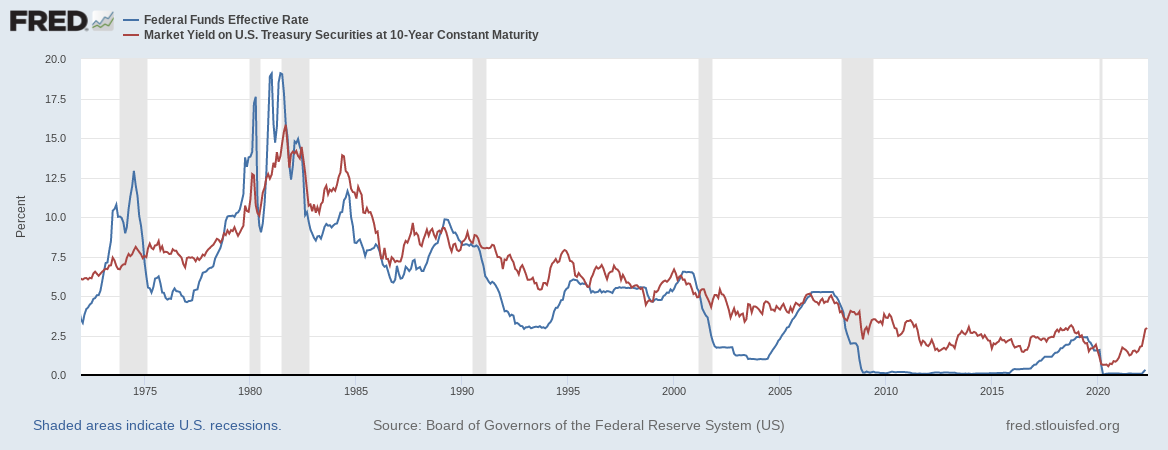 The treasury market is "out in front" of the Fed at the moment; the market pushed yields at this spot as high as 3.12% on May 6 before falling back to ~ 2.8% as of this morning. My current expectation is that the treasury market is going to trade sideways for a while, as the Fed "catches up", and absent additional inflationary surprises, I would expect the 10 year to end this cycle in the 3 - 4% range. (I don't profess to know, just guessing based on the historical pattern). Speaking of inflation, the market has an opinion about where we are headed: 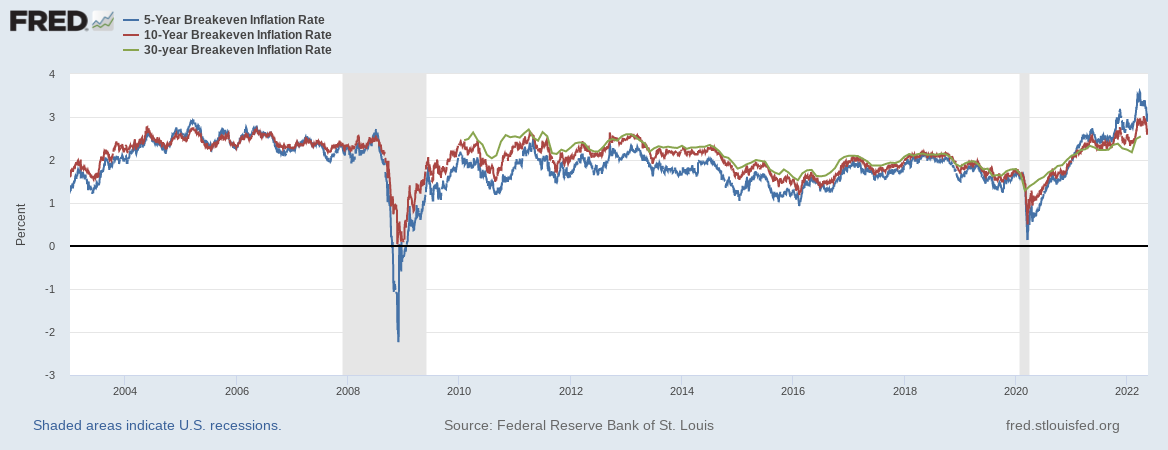 The US Treasury issues both "regular" and "inflation adjusted" bonds; at a given maturity, the difference in market yields between those two informs a so-called "breakeven" rate that we assume approximates inflation over that period. This seems to suggest the market things inflation over the next 5 to 10 years will average out to around 3 - 3.5% The image above shows the breakeven rates at the 5, 10, and 30 year spots. It is not unique over that history for the 5 year spot (shown here in blue) to exceed the 10 and 30 year spots, but the degree of excess in recent history is meaningful. Here it is zoomed into the last 12 months: 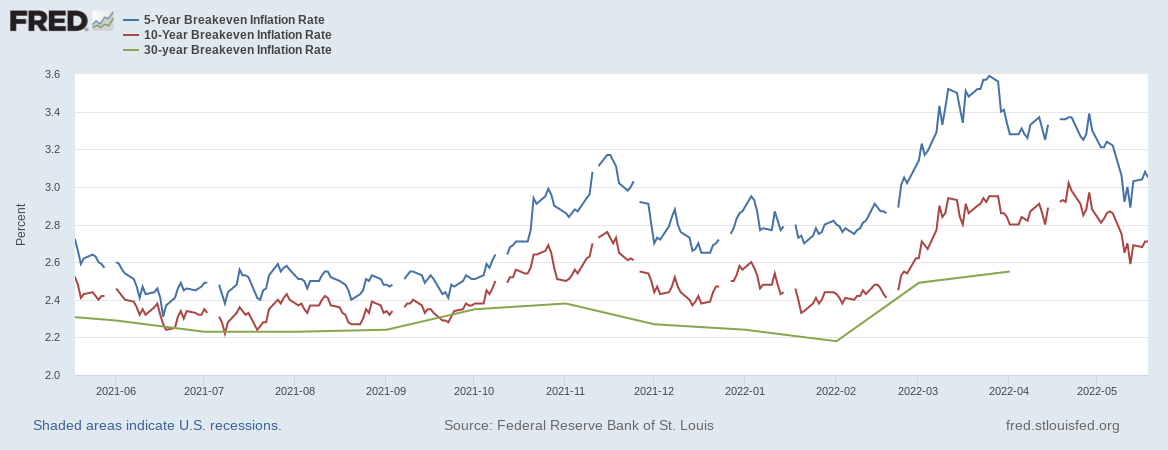 To me, this suggests that the bond market (currently) believes that inflation will top out and reverse course within the next 5 years, or quickly enough so as not to impact values as much over the 10 year span. All of this has implications for portfolios holding bonds or bond funds. Most of my clients do have allocations to bonds, and those positions took a major hit as interest rates rose. If interest rates continue to rise, the value of those positions will continue to fall...that is simply the nature of bond market pricing. However, bonds and bond funds distribute meaningful cash flows to investors that allow for tactical reinvestment, and if the thesis about rates going sideways for a while is correct, the worst may be over for high quality bonds. StocksLongtime clients and readers know that I have held concerns about stock market valuations since at least 2019. By the end of that year, and using the price to earnings multiple for the S&P 500 index, stocks were overvalued by as much as ~ 50%; using an alternate valuation version that "smooths" the earnings part of the metric over a 10 year period made it look even worse at about 80% overvalued. There were some structural changes to consider: the tax regime was very different coming out of 2018, and that resulted in a step-change in corporate profits that could potentially justify the growth in P/E. And then, after the COVID shutdowns hit the markets and stimulus efforts began, all bets were off. So many dollars hit the market and eventually found their way to risk assets (stocks, investment properties, cryptocurrencies...) that the S&P rose about 47% from the end of 2019 to the high point in December 2021. Even after the recent sell-off, the S&P is still about 20% higher than December 2019. Is this an interesting time to point out that the nominal compound annual growth rate of the S&P since 1871 is about 9.37%? Projecting stock market valuations is fraught; one may Google recent headlines from big banks like JPM Chase, Morgan Stanley, Bank of America and get a sample of where they see the S&P closing out 2022. My view has been that I won't be surprised if the index revisits levels seen at the end of 2019; that would represent another ~ 20% decline from current levels and approximately a ~ 40% decline from the highs. My concern around the market falling that far has actually lessened a bit in recent weeks, but ultimately my intention is not to try to time the markets, but to prepare for range of outcomes based on relative likelihood...which is a good segue: So what do you do?For myself and clients who ask me to manage their investments, my process is rooted in study and experience:
Stay safe out there. If you are a client, please feel free to reach out with questions about your investments and financial planning concerns. If you are not a client and find yourself interested in an advisory firm that takes the time to nerd out on occasion, feel free to fill out our contact form here: https://www.drwfinancial.com/contact.html This blog post is intended as market commentary and to be educational. It does not imply certain knowledge of where any market or index is headed. Past performance does not imply future performance.
DRW Financial offers a full suite of financial planning and investment management services, and we want to make sure that our new and existing clients realize the full value of their engagement with us. This post is meant to provide an overview of the different types of service and work we do with clients, but is not exhaustive. Particular client situations often lead to unique planning projects; these items apply to a broad set of circumstances: Flow charts, check lists, and decision trees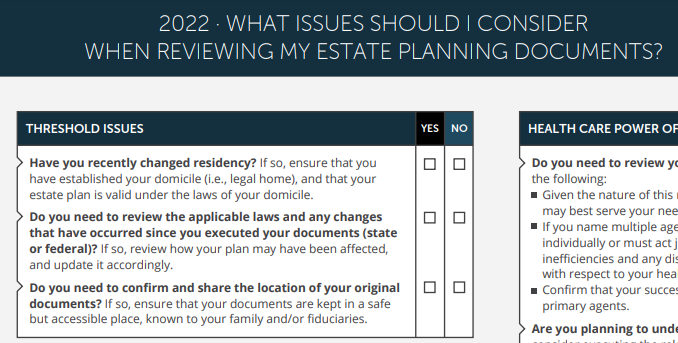 Personal financial planning can quickly go from "rules of thumb" to incredible complexity based on a given household's actual situation. We have found great value in these resources that facilitate a conversation around a client's specific needs. We have resources around the decision framework for Roth vs traditional retirement, how to transition from employed health insurance to Medicare, and checklists for issues related to divorce, the death of a parent/spouse, etc. If you reach out to DRW Financial about a particular concern, we will gladly share these resources and help you navigate your situation. Portfolio Review
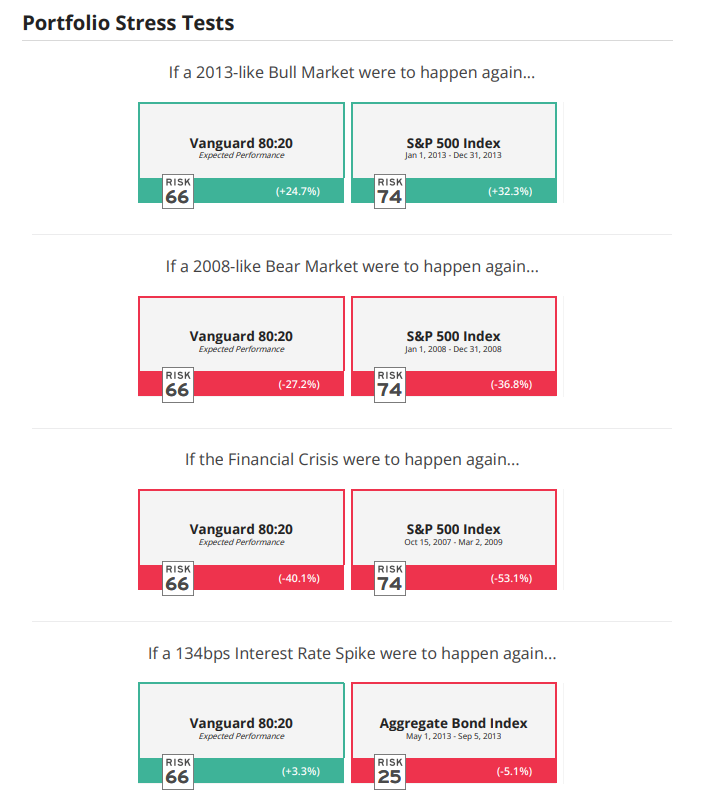
These are sample images from a platform we use to gain quick insights into the underlying structure, cost, and risk of a given portfolio. These reports often provide a starting point for deeper conversations about how to dial in an investment strategy for a particular client or goal. We can provide these reports on request for portfolios managed in-house as well as those held away, whether with another financial advisor, broker, or in a plan such as a 401k. Tax Planning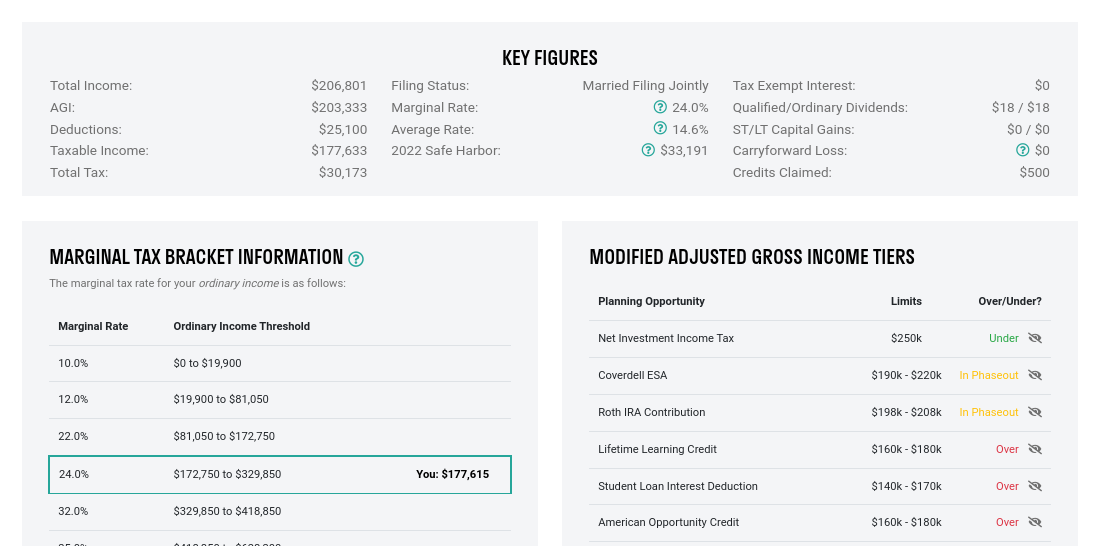 DRW Financial does not provide tax advice and does not prepare tax returns, but does provide guidance around the intersection of tax and financial planning. We use reports like the sample shown here to help clients gain clarity around their taxes, and better to understand where there may be planning opportunities. This type of analysis sometimes flows into scenario modeling for planning alternatives such as how a Roth conversion may impact taxes now or later. When clients (securely) provide us with copies of their returns, we can produce this type of analysis on demand. 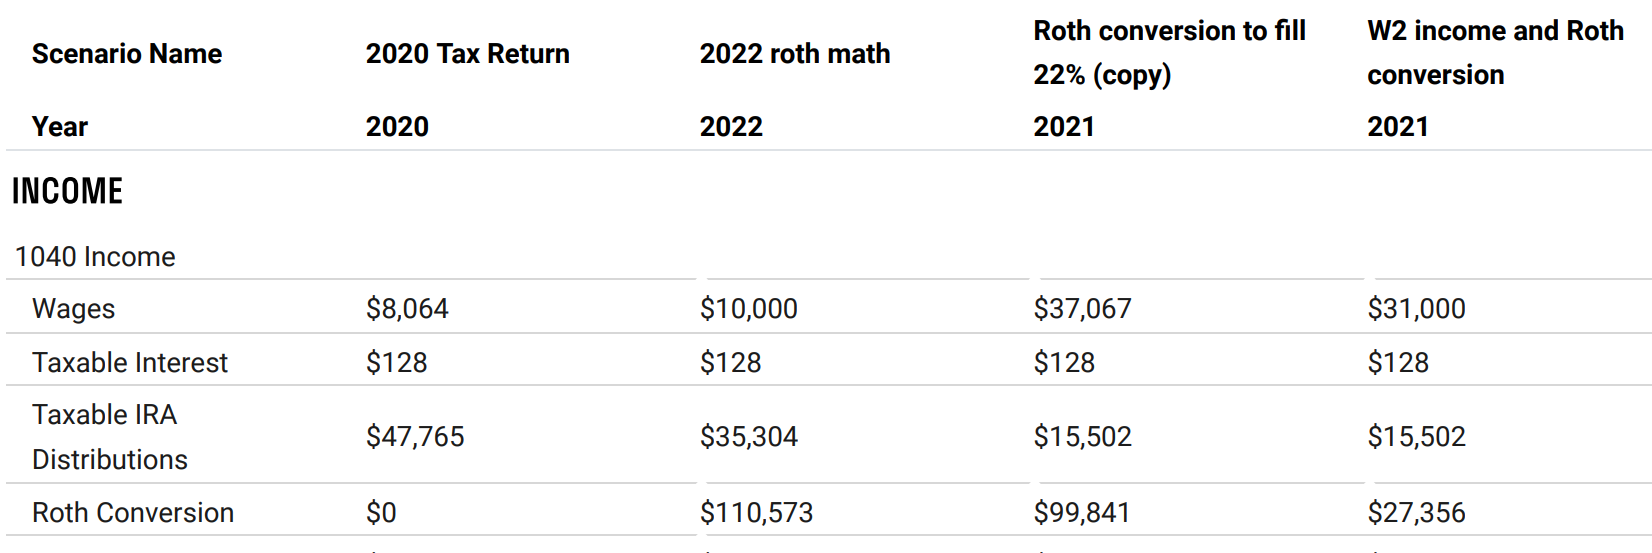 Retirement Income Planning and Projections
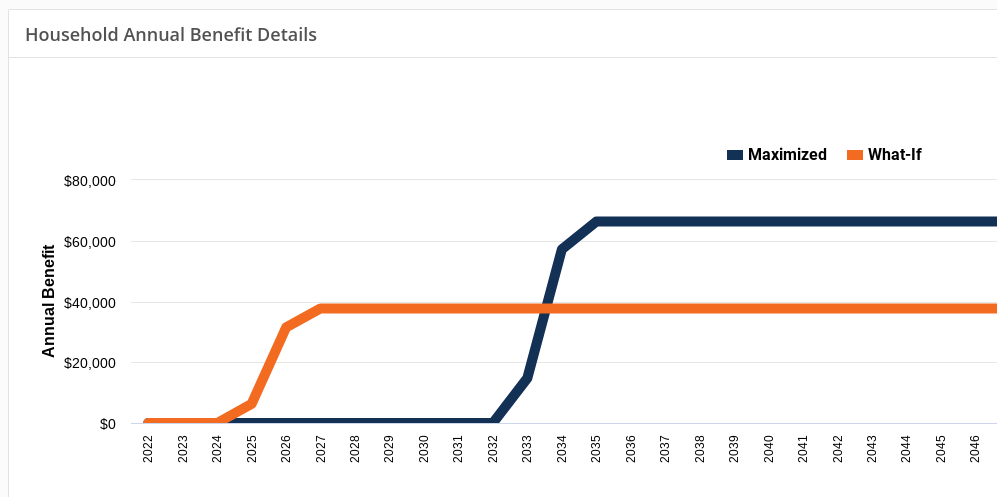
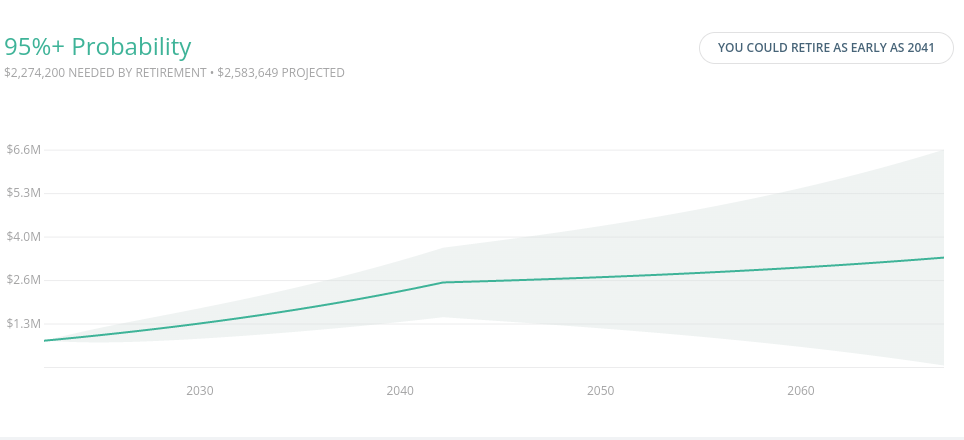
We combine best-in-class resources to analyze the strategies and opportunities for optimizing the retirement phase spending plans, including social security (the first image above), and various investment options. The aim of this process is to help clients to a place of increased clarity and confidence around their retirement goal; sometimes this means uncovering challenges that need to be addressed, and sometimes it means recognizing an abundance that enables new opportunities. What rounds out a comprehensive plan?DRW Financial clients can "opt in" to planning and investment management engagements that address all of the above, as well as other planning areas:
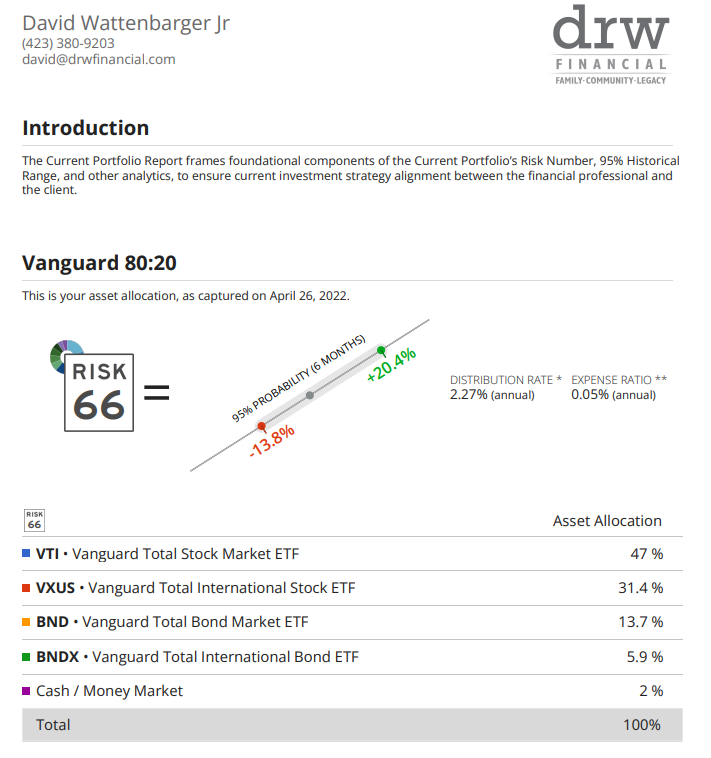
And if you are prospective client, you may schedule a free initial consultation via www.DRWFinancial.com 4/26/2022 Market commentaryThe last few days, and in fact this whole year so far, has presented some volatility and periods of market decline that may come as a surprise to those who have gotten accustomed to prices only "going up". This post seeks to put the current market in a broader context and share some of my thinking about what may be ahead of us. 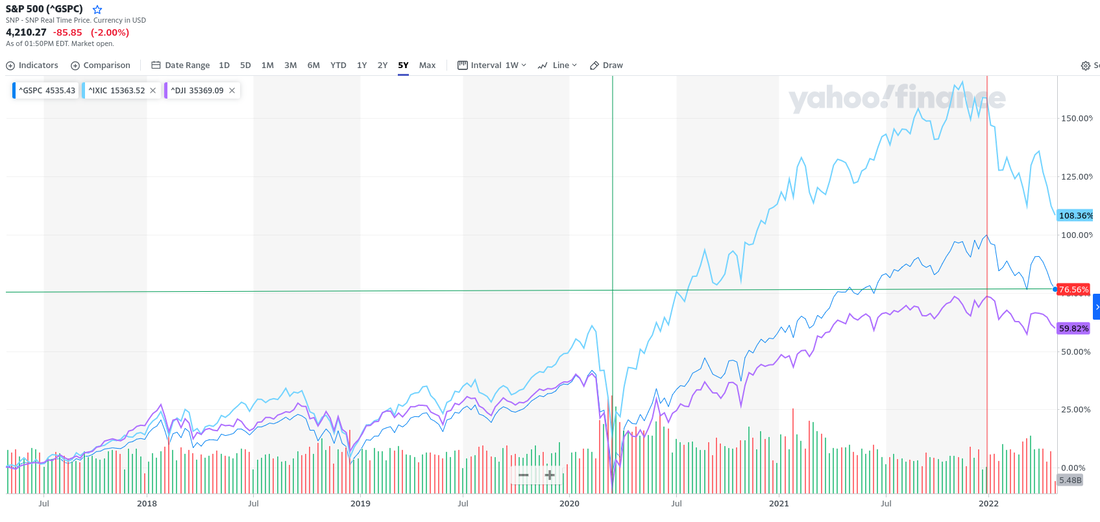 This chart shows the last 5 years of market movement for the S&P 500, Dow Jones, and NASDAQ indexes. The green vertical line shows the approximate worst levels of the early COVID related market crash, and the red vertical line shows the highest level on the S&P. As of this writing, the S&P is down about 12% from that high. The 5 year picture, and the YTD picture taken together provide some interesting context. Our experience is that the market can be volatile, with significant swings in price, and looking at too narrow a slice of time can be very misleading. It is a bit wild to see how much the markets grew during the COVID pandemic. 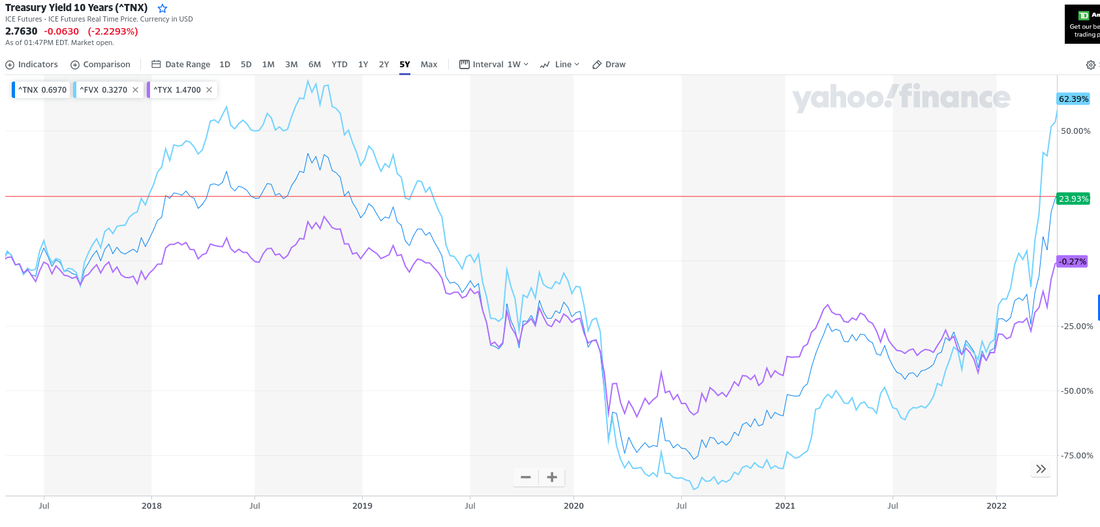 This second chart shows the path of interest rates over the last 5 years, specifically the rates for the five, ten, and thirty year US treasury bonds. The horizontal red line shows the current level of the ten year treasury. Many parts of our economy price off of the treasury market; corporate and municipal bonds, for instance, will generally yield some amount over the treasuries of similar term. Mortgage rates also tend to follow the treasury market, particularly the ten year yield. So a chart showing rates in the rest of the bond and mortgage markets would generally have the same shape. Bond prices move inversely to their yields, so this year-to-date has been very rough on bond prices and funds...at the same time that stocks have sold off. Historically the relationship between stocks and bonds has varied, but in the era of Fed and US government "stimulus" programs to ward off the worst outcomes during the "great recession" and now the COVID era, stocks and bonds have been trading together more often. So what is coming next? 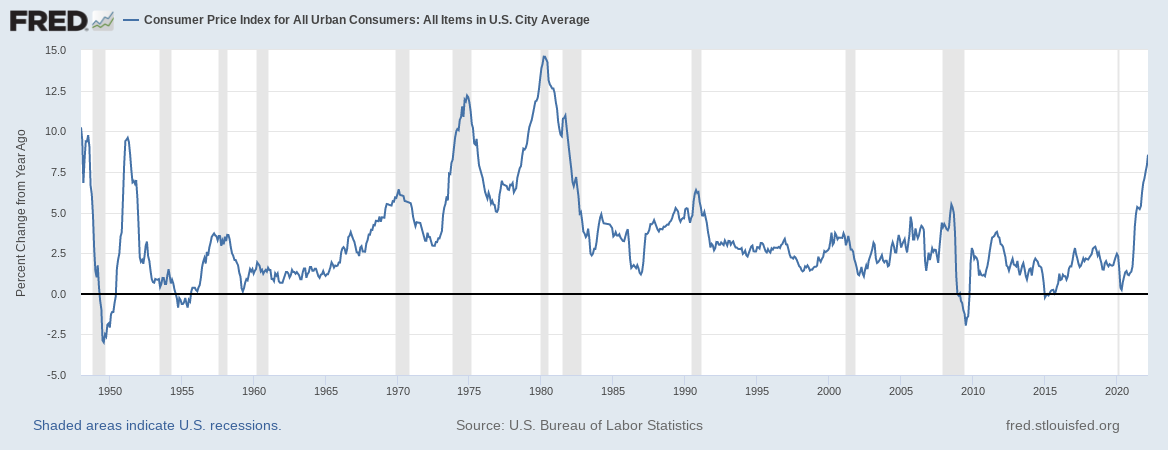 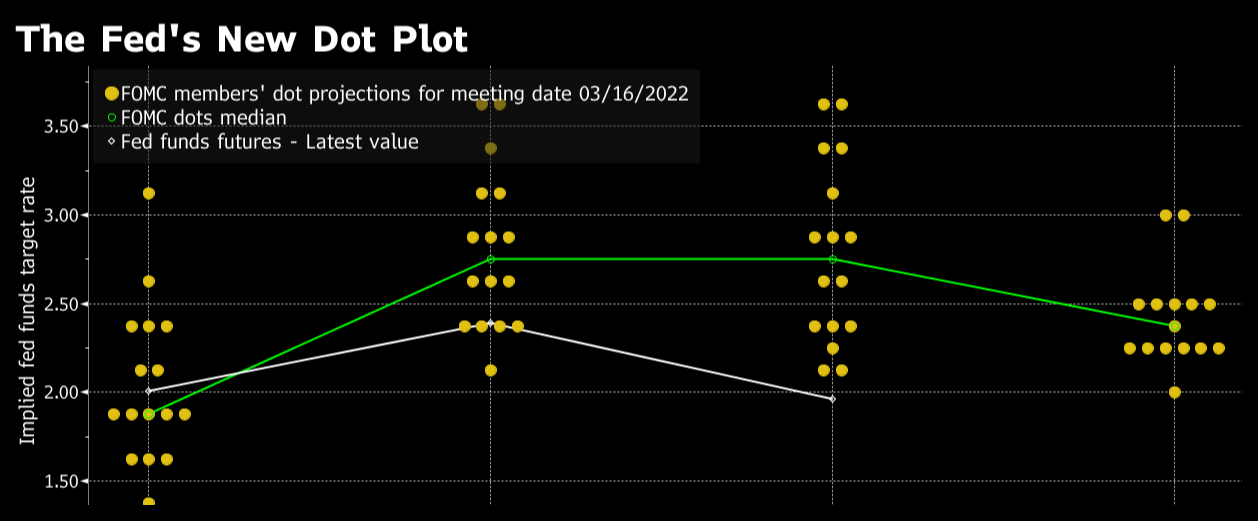 These two charts are related -- the first is a graph of the main measure of US inflation, and the most recent spike has been in the news headlines and on our grocery store receipts. The second chart (from the Bloomberg article linked below) is the so-called "dot plot" projecting the Federal Reserve's likely path for their interest rate targets. When the Fed raises rates, the short end of the treasury market will follow suit...or, in our current case, the treasury market will move in anticipation of the Fed. The current dot plot suggests that the Fed may eventually raise rates into the ~ 2.5% range. If inflation readings keep coming in hot, the Fed will likely adjust their target even higher. 2.5% is high relative to the recent levels near 0% that were put in place to stimulate / protect the economy, but is not high relative to the long term average. Taken all together, this data paints a picture that to me suggests a few things:
My investment management approach will likely continue to follow the pattern: an asset allocation model that includes stocks and bonds and cash in proportion to the individual client's capacity for risk and investment goals. This approach has historically offset some amount of volatility and maintained the potential for economic returns over time. I am available to discuss the particular advice and investment allocation for a given client on request. Historical returns do not guarantee future returns. This post is not intended as advice or a solicitation of any kind. Dot Plot article: https://www.bloomberg.com/news/articles/2022-03-16/the-fed-s-new-dot-plot-after-its-march-policy-meeting-chart
For those with both the means and the desire to support one or more charitable projects or organizations, there are several strategies available. Choosing the right strategy or blend of strategies can help the donor optimize the impact of their gift for their particular situation. This post assumes that the donor has a charitable intent -- while there are some financial benefits to giving, the overall success of these strategies ultimately depend on a desire to support one or more charities. Gifts of appreciated stock (and other assets)Assets, like stock held in a taxable brokerage account, may appreciate over time and when they are sold, the difference between the "basis" and current value may represent a capital gain and therefore a tax liability. Under current laws, "short term" capital gains on assets held less than a year are taxed at the investor's marginal income tax bracket, and "long term" capital gains are generally taxed at lower rates, but still on a graduated schedule. Gifting an appreciated asset to a qualified charitable organization may provide a relative benefit to the donor versus "writing a check" from cash for a similar value donation.
And even those who do not itemize may have the opportunity to deduct up to $300 of giving. This post describes the 2020 version of this rule, and for 2021 the rule is expanded to allow households filing "jointly" to deduct up to $600. Gifts from an IRA - the "QCD"Traditional IRAs -- retirement accounts funded by "pre tax" contributions and that deferred taxes on growth and income over the years -- often represent a significant portion of a donor's accumulated wealth. But just as in the example above, actually accessing that wealth comes with a tax liability. Every dollar withdrawn from a traditional tax deferred retirement account in retirement adds to the investor's income for the year, and is therefore subject to their marginal income tax bracket. For people who happen to have relatively high social security benefits, or pension income, etc. their marginal income tax bracket in retirement may be quite high. Under current tax law, donors over the age of 70.5 may choose to donate to a qualified charity directly from their IRA via what is called a "qualified charitable distribution". An aggregate amount up to $100,000 per donor may be excluded from their taxable income for the year.
The QCD provision is one that has come and gone in tax law in recent years, and the SECURE Act made changes to both RMD rules and age restrictions on IRA contributions that may make the QCD less attractive for certain donors. "Planned giving"This is a sort of "catch all" for gifts to charities made via estate planning tools. Many donors reserve their largest gifts to be part of their estate, leaving money to one or more charities after their death. In some cases, planned gifts may have multiple stages, with some parts beginning during the donor's life. This is an intentionally minimal treatment of the "planned giving" space; the details and implementation of planned giving strategies can become very complicated, very quickly:
Planned giving can have meaningful impacts for both the donor and the recipient organizations, but also require a level of sophistication by all involved parties. Donor Advised Funds & Community FoundationsIn some cases, a donor's capacity and philanthropic intent coincide, but their ultimate goal for impact is not yet resolved. In these cases, it may make sense to use a "donor advised fund". There are national DAF programs run by financial institutions like Fidelity and Vanguard, and many regions also have local options like community foundations. In general terms, a donor may choose to make a large gift to a DAF in a given year, and then "advise" on the further distribution of those funds to one or more charities over time. This approach may be especially useful for donors looking to "bunch" their deductions in a given year to make itemized deductions possible or more attractive; DAFs may also be a handy intermediary for making gifts on to charities with less sophisticated in-house capabilities. For example, a given charity may not be set up to accept gifts of appreciated stock, so a donor may gift the stock to a DAF and then ask the DAF to make a gift of cash to the target charity. It is important to note here that the gift to the DAF or community foundation is "complete", meaning that the donor has no legal right to the further use of the funds. They are allowed only to "advise" on their preference for how and when the funds are distributed. Get good, tailored adviceThis blog post is not intended as tax or legal advice. David and DRW Financial have a philanthropic planning niche, and we care a great deal about part of the financial advice space, but every donor's situation is unique and their particular tax and planning needs must be considered in context. There are various limits on charity related tax deductions and specific rules that may make a given strategy more or less attractive for a given donor.
Before taking action, donors may wish to speak with a qualified tax professional, trust & estate lawyer, financial planner, or charitable advisor. 11/24/2020 Charitable giving opportunity for 2020 One special provision in the CARES Act can help you and your favorite charityThe last few years have featured many changes in tax laws, and it can be easy to feel overwhelmed or lost in those changes, but there is one new rule that can provide a pretty straightforward benefit for most tax payers AND one or more of the philanthropic causes they support. The short version, per a quote from the IRS wesbite: ...taxpayers who don't itemize deductions may take a charitable deduction of up to $300 for cash contributions made in 2020 to qualifying organizations. For the purposes of this deduction, qualifying organizations are those that are religious, charitable, educational, scientific or literary in purpose. The law changed in this area due to the Coronavirus Aid, Relief, and Economic Security Act. Deduct up to $300 from taxable income, without "itemizing"Historically, to deduct charitable giving on a personal tax return required that the tax payer "itemize", and when the "standard deduction" doubled recently, many taxpayers found it difficult to itemize enough deductions to be worthwhile. This new provision in the CARES Act allows taxpayers to deduct up to $300 without itemizing.
For detailed questions on your taxes, I recommend speaking with a CPA or Enrolled Agent. For more insights on charitable giving, philanthropic planning, and how to align your finances with your values, please consider engaging an advisory firm like DRW Financial. David holds the Chartered Advisor in Philanthropy® designation, and loves working with non-profits and their donors. 5/22/2020 May 2020 updates and insightsIt has been a bit since I have collected together my thoughts and observations on the market, the economy, and implications for financial planning best practice. Some of this post will get technical and long winded, so I will try to capture the headline level here at the top. Market volatility is [probably] not overAs of this writing, the S&P is still about 14% below the market highs in mid February, and about 9% below the start of the year. That reflects a remarkable "bounce back" from the lowest numbers in March [approximately +31% from March 23 to today]. As a participant in the markets as an investment manager and investor of my own funds, I certainly appreciate this bounce. But I retain a significant amount of skepticism about the economics underlying the market. So if there is a prime takeaway from this post, it is that I expect additional volatility in the weeks and months to come. I will stay invested and will counsel my clients to stay invested, but in a posture that reflects the economic reality and in line with each person's specific goals and tolerance for risk. Now, to the data, observations, and insights. The economy =/= the marketThe Congressional Budget Office is projecting significant contraction in the US economy through the COVID 19 pandemic. 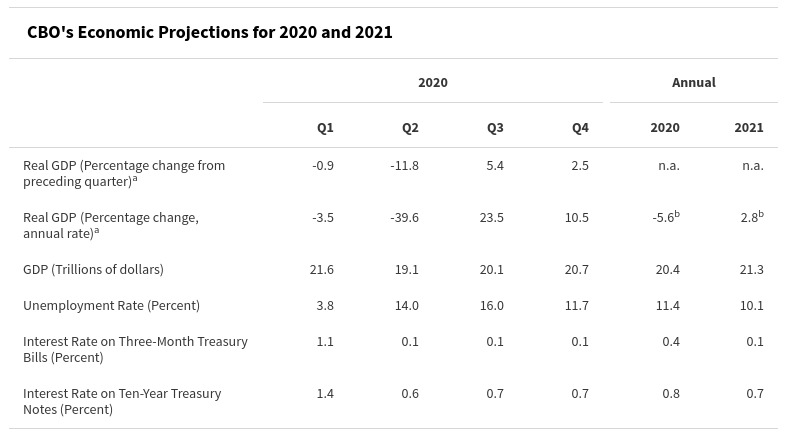 The Q1 numbers are already behind us, and the projected drop in GDP to NEGATIVE 39.6 is expected to lead to a negative real growth rate for the year of ~ 5.6% Against this backdrop of expected economic contraction, the stock market (at least as represented by the S&P 500 index) has regained a lot of ground lost during the "shut down". If you dial out the perspective to a 12 month or longer view on the index, returns are now positive -- from May 22, 2019 to today, the S&P is up about 2.75%. This disconnect between the market and the economic data can be jarring and confusing, and often leads to the invocation that "the market is not the economy". They aren't the same, but are related. Stock market investors are generally assumed to be buying into a share of future net income from the companies they choose to own. The earnings from any given company can diverge from the broader economy in the short term, and for a very limited number of companies that diverge could persist for a while, but my expectation is that over time, the valuation of a company's stock should reflect the economy that they operate within. Why is the market "going up"?I will continue to maintain a humble awareness that I cannot know anything for sure about the present or future state(s) of the financial markets, but I can make some informed guesses about pieces of it. It is a reasonable question to ask: if the economy is really hurt, why would the stock market go up? From where I sit, there are two primary drivers of the index valuation since mid March: cash from the government (& Fed), and outsized index constituents. 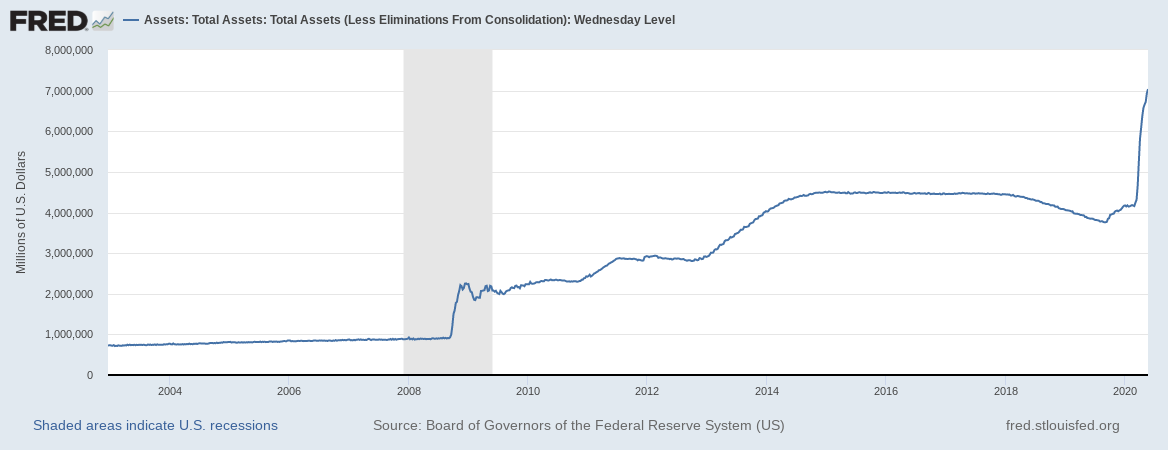 This chart shows the "balance sheet" of the Federal Reserve going back to the early 2000s. The shaded bar covers the period of the "financial crisis" or "Great Recession", and that sharp uptick in the chart was when the "bailouts" and "quantitative easing" and other financial interventions happened. The Fed's balance sheet doubled in that phase, from just under one TRILLION dollars to more than two. The Fed remained invested in the market at elevated levels, creeping up over time to about $4.5T, and then in March of this year jumped about 75% to ~ $7 trillion. We throw around big numbers a lot in discussions of financial markets and the economy, so it may help to put ~ $2.5T to $3T in context. The image below shows the (2018) GDPs for Germany, Italy, and France: 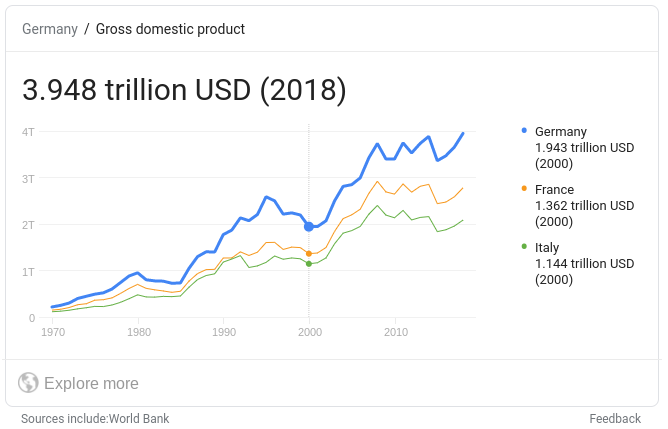 So far this year, the Federal Reserve has injected cash to our economy roughly double the entire GDP of France (and 3/4 of our own GDP from 2018). For another comparison that also leads to my next point, the largest companies in the US are all grouped roughly around $1T in "market capitalization". Apple, Amazon, Microsoft, and Google are all valued at +/- $1T in the current market -- the Fed pumped the rough equivalent of two to three "Googles" into the economy in a matter of weeks. Those four stocks also play a role in my understanding of the current index valuation. I will focus on just one as an example here, but all four are shown in the chart below. 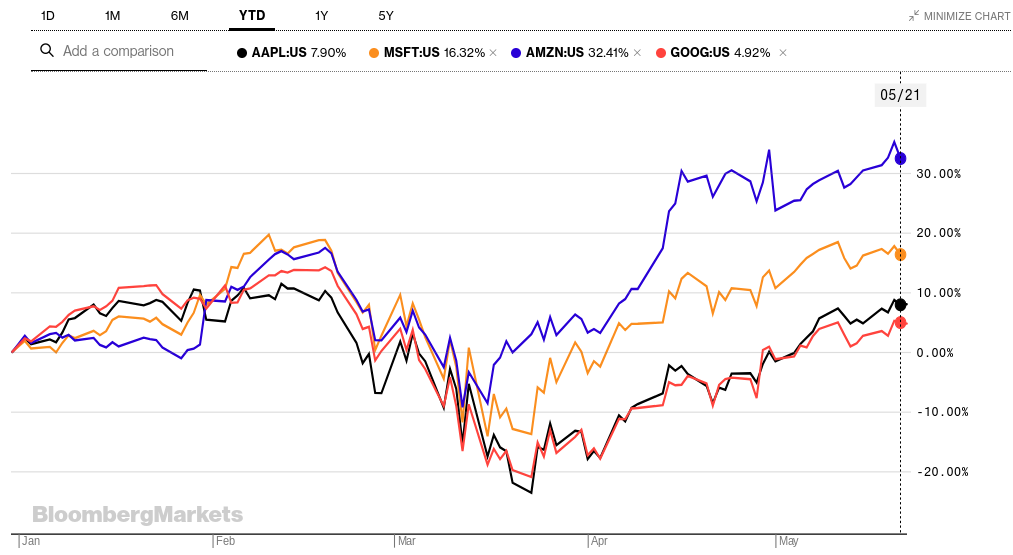 Microsoft is up more than 16% year to date, maybe because people are relying more on their cloud products during "work from home" or buying Xboxes or whatever. The WHY is less important than the WHAT for the moment. At present, MSFT makes up about 5.6% of the whole S&P 500. In a overly simplified calculation, about 90 basis points of the S&P's return for 2020 so far comes from Microsoft. If you took MSFT out of the index, instead of the S&P being "down" about 8.9% on the year, it would be down about 9.75%. Apple, Microsoft, Google, and Amazon are the largest components of the S&P, and all are up big over the last few months, and up even more over the last year. Removing their contributions from the index makes the overall "stock market" returns look very different. This dynamic is one reason that my approach to investing is inclined to the use of "index funds" and away from picking or holding individual stocks for most clients. It is VERY difficult to know well in advance which small handful of stocks is going to do well in any given cycle, and marginally less hard to guess whether or not the "whole market" is going to rise or fall. For today's post, the point about MSFT et al is that they are experiencing outsized returns during the pandemic and because they are huge contributors to the index valuation, those outsized returns are propping up the "market" in a meaningful way. So what will happen next?Over the last few weeks I have been revisiting "professional" market projections from late 2019, well before the COVID 19 crisis was on anyone's RADAR. Banks and financial market participants like Morgan Stanley, Vanguard, etc all put out their capital market assumptions for the coming cycle, and the projections made in the 4th quarter of 2019 were...lackluster? Many of the projections were cautioning investors to prepare for "real" (meaning inflation adjusted) returns of less than 4% or 5% annualized for a number of years. It is entirely possible that those numbers anticipated some number of "shocks" to the economy and the markets, but I strongly suspect that none of those projections figured on a calendar 2020 with negative GDP growth of 5% to 6%. So in the context, I am trying to plan and position for subdued equity returns in the overall market, and looking for opportunities to create and realize value in that environment. I would be remiss to ignore interest rates in this discussion. Just this week, the UK issued a new three year bond at "negative yields", and the US issued a new 20 year treasury bond at about 1.2%. Overall interest rates remain at or near historic lows, and part of the Federal Reserve's growing balance sheet came through purchases of corporate and municipal bond funds, providing some pricing support (and lower yields) in those markets. While it is tempting to say things like "interest rates CAN'T go lower", that would be irresponsible and unsupported by the data. I DO tend to believe that interest rates will rise from here, but am obliged to plan for a variety of paths forward, including some version of sustained "zero interest rate policy" How to react?If you have a robust financial plan, now is probably the time to focus on executing that plan. Reviewing asset allocations, identifying tax improvement opportunities, refreshing estate planning and asset location strategies -- these may all be productive steps to take during the present "crisis". If you DO NOT have a robust financial plan, it is past time to address that gap. Whether with DRW Financial or another professional offering advice as a fiduciary, having a plan in place should increase confidence that your particular goals are addressed. My blog posts are not intended as a solicitation for new clients, or
as a recommendation to buy or sell any investment, or to follow any investment or tax strategy. They are intended to provide some educational perspective on the markets and economy. If you would like actionable advice and live in a state where DRW Financial is registered to operate, feel free to reach out via email. This post focused on target date funds, but could similarly apply to a "passive" portfolio of index funds that includes an allocation to bonds. Target retirement date mutual funds have become a mainstay of employer sponsored retirement plans (401k plans, for example), and many retail investors are choosing these options as well for their simplicity. The general idea of a target date fund (TDF) is that the fund holds a mix of assets - -mostly stocks and bonds -- in proportions that shift over time to lower the portfolio's expected volatility into the retirement date. In overly simplistic terms, this means that a far off target date fund will hold mostly stocks, and a very close target date fund will hold a relatively high proportion of bonds. For one example, consider the Vanguard Target Retirement 2040 fund, symbol VFORX: 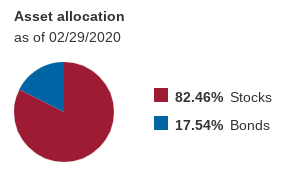 This fund is meant for investors who believe that the year 2040 is likely when they will begin taking retirement distributions from their savings, or at least represent the amount of risk they want to take with those savings in the present. The Vanguard page for this fund also shows the underlying funds that make up the TDF: 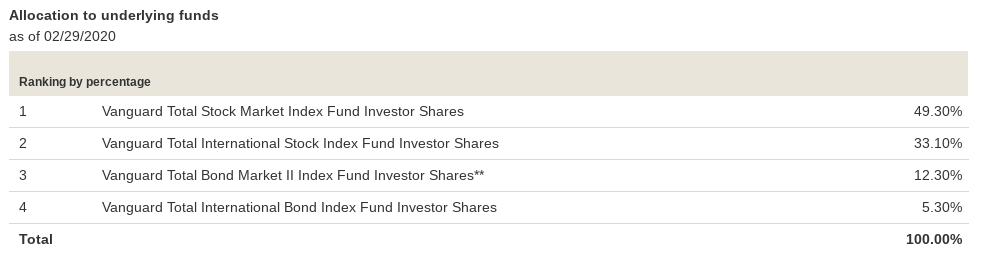 For this blog post, I want to focus on the bond allocations within this fund. We can get more information on each, as they trade independently of the TDF under the symbols VTBIX and VTIBX. For further simplicity here, I will focus solely on the domestic fund, VTBIX. The rationale for holding bonds in a "diversified" portfolio along with stocks is that they historically represent different types of risk, and they typically respond differently to major shifts in the market's perception of risk. Often, in times of distress for the stock market, some investors will shift some of their money from stocks to bonds in pursuit of more stability or predictability, and this shift may raise the prices of bonds temporarily. And this general dynamic played out in the recent stock market correction related to the COVID 19 virus -- stocks fell, and at first bonds of almost every type rose. A subsequent wave of market reactions pushed US Treasury bonds higher still, but bonds of almost every other type (corporate bonds, municipal bonds, mortgage backed bonds, etc) fell a considerable amount as the market adjusted to consider the risk of those bond issuers "defaulting" on their obligations. For example, investors were forced to consider if bonds backed by a particular retailer or airline or car company would pay as expected if those companies were forced to close or go into bankruptcy. The chart below is clipped from CNBC, and shows the "year to date" price of the bond fund. That peak in early March, the sell off over the next two weeks, and the rebound up to today all match the general pattern of bonds in the market (except for US Treasuries which saw a much more muted sell off in mid-March) 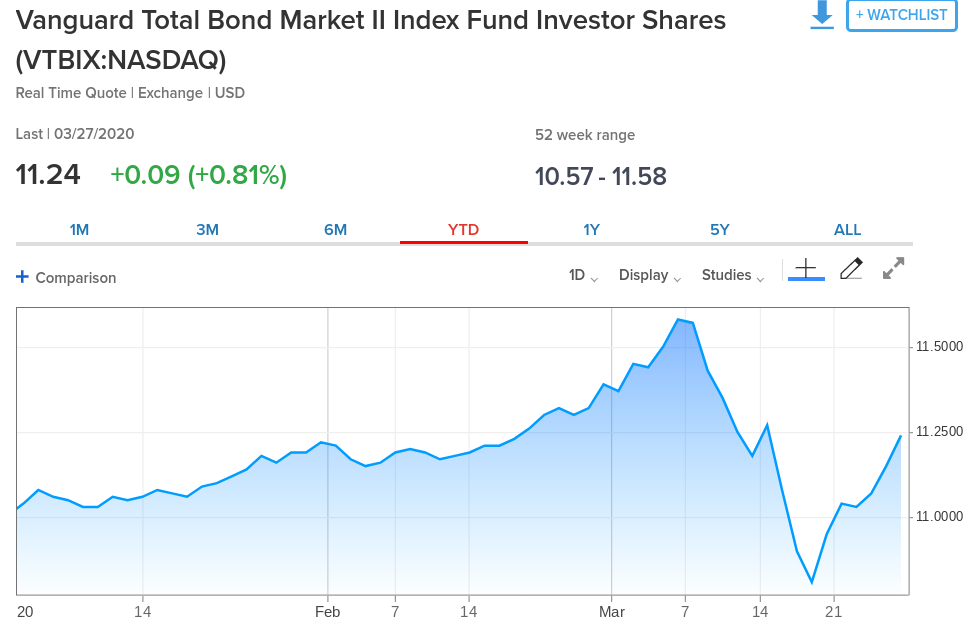 This all leads to the inspiration for today's post: what does it mean to continue to hold bonds in the current market? Will bonds continue to provide the volatility dampening effect as per historical precedent? Pulling together fact sheets, prospectuses, and other resources on this particular Vanguard fund suggests that the current composition of underlying bonds is roughly 44% US Treasuries, with another 22% in mortgage backed bonds from "government sponsored entities" like Fannie Mae and Freddie Mac. In the current environment, the Federal Reserve is actively buying up those two categories of bonds to provide support and liquidity to the market -- this means, that all else held equal, the prices of those categories of bonds are being pushed higher and their yields pushed lower. For the VTBIX fund, the SEC Yield is currently just under 2%, and the distribution yield just over 2.5% -- but the underlying "yield to maturity" of the bonds held by the fund is ~ 1.70%, an average duration of more than 6 years, and an average maturity of more than 8 years. Taken all together, an investor holding this fund (or one very similar) may want to consider the possible paths for forward for economic gain in the fund, or the ways this holding may contribute to the overall performance of their portfolio. The "total return" of a bond or bond fund is made up of cash flows and price movement. As in the chart shown above, an investor buying the VTBIX fund on March 17 or so would have experienced a rise in price in addition to whatever dividends and interest the fund paid out during the holding period. And an investor holding that fund from March 7 to March 20 would have seen a meaningful shift to a lower price. A question I am asking myself and on behalf of my clients in this market is what may I rationally expect for bond and bond fund prices looking forward? The author holds no positions in the referenced funds, and is not soliciting a buy or sell of any security.
We ARE reviewing client investments in the current context of compressed interest rates and prospective returns on bonds and fixed income allocations. 3/9/2020 You should revisit yield to maturityThe recent collapse in US bond yields to all-time historic lows presents an opportunity and an obligation to review the prevailing yield to maturity (and yield to "worst") of the bond and "fixed income" portions of an investment portfolio. 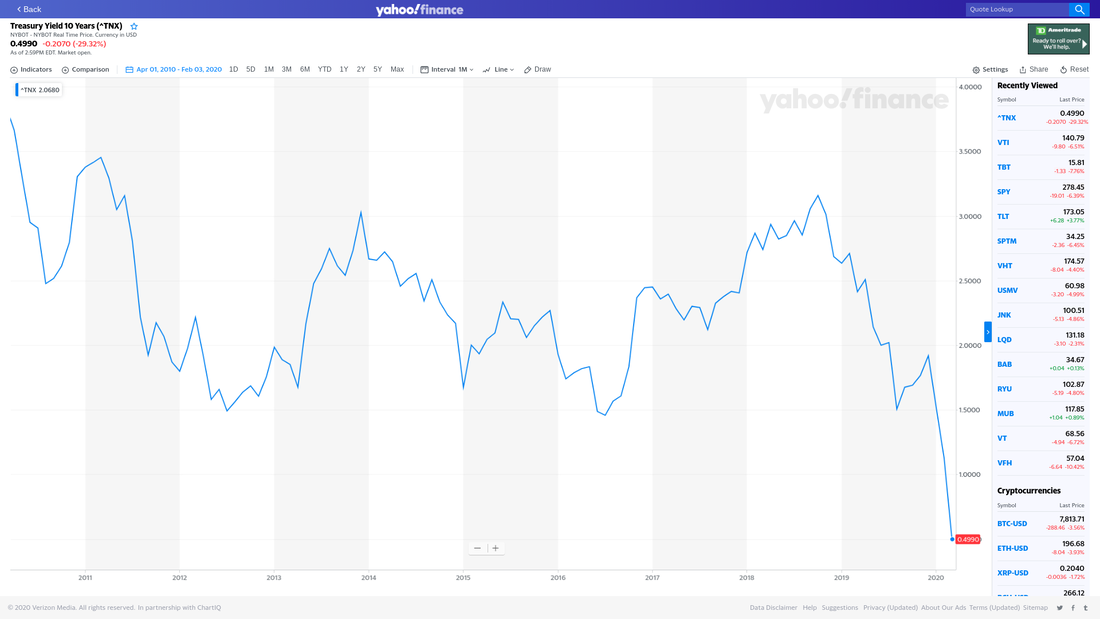 We know that bond prices and yields are inversely related, at least for bonds with fixed coupons and no call features. As yields rise, prices fall; as yields fall, prices rise, all else held equal. In asset allocation theory, an investor may hold bonds as a sort of counter-weight to stocks -- while stock and bond prices may move together and in the same direction at times, when volatility in the market rises and stock prices fall due to perceived risk, bond prices tend to rise as investors seek more stability in more predictable investments. That dynamic has played out in the US investment markets over the last few weeks as the major stock indices have fallen by double digit percentages. Holding to Maturity, or notThe value of an individual bond is set by its yield. That is, the market sets a yield for the risk associated with that bond, and the price is calculated from that yield. A bond can have several different yield measures: yield to call, yield to maturity, yield to worst...From the perspective of the investor holding a bond, the "yield to worst" may best capture their economic opportunity. Bond funds do not behave exactly like individual bonds, but the value of a bond fund should relate to the underlying value of the bonds it holds. An investor who buys a bond or bond fund and then sees the relevant market yield for that investment fall should see the price of their investment rise, and so is presented with an opportunity to continue holding the investment or selling it at a gain. The decision between those options will require some analysis and will depend on the investor's particular circumstances. Original YTM and prevailing YTM aren't the sameWhen an investor buys a bond or bond fund, the yield to maturity on that day and at the price they pay does matter -- it establishes a basis and informs the expected holding period return if the bond is held to maturity. But as the price of the investment changes and the term to maturity decreases, the prevailing or mark-to-market yield to maturity (and yield to worst) also matter a great deal, but are often overlooked by investors and their advisers. Consider an example where a client buys a bond of SAMPLE COMPANY to yield 4% for 10 years, and in a few months finds that the market has set a new, lower yield for that bond at 2.5%...this would mean that the price of the bond would have risen to set the market yield for the bond at ~ 2.5% -- the investor could sell the bond at a capital gain to other investors who want the 2.5% yield. Why would a person sell in this situation? If their original goal was to earn 4% returns on their money, they may not be content to "only" earn 2.5%, but that is the remaining opportunity for that investor over the term of the bond. What's special about the current market2/27/2020 Brief market commentary - going viralAs of 10am this morning, the US stock markets look headed for another significant drop. The Dow Jones Industrial index is down more than 1.5% on the day, bouncing between -450 and -650 points, depending on when you look; the S&P 500 is down almost 2%. This is a chart showing those two index levels over the last 12 months: 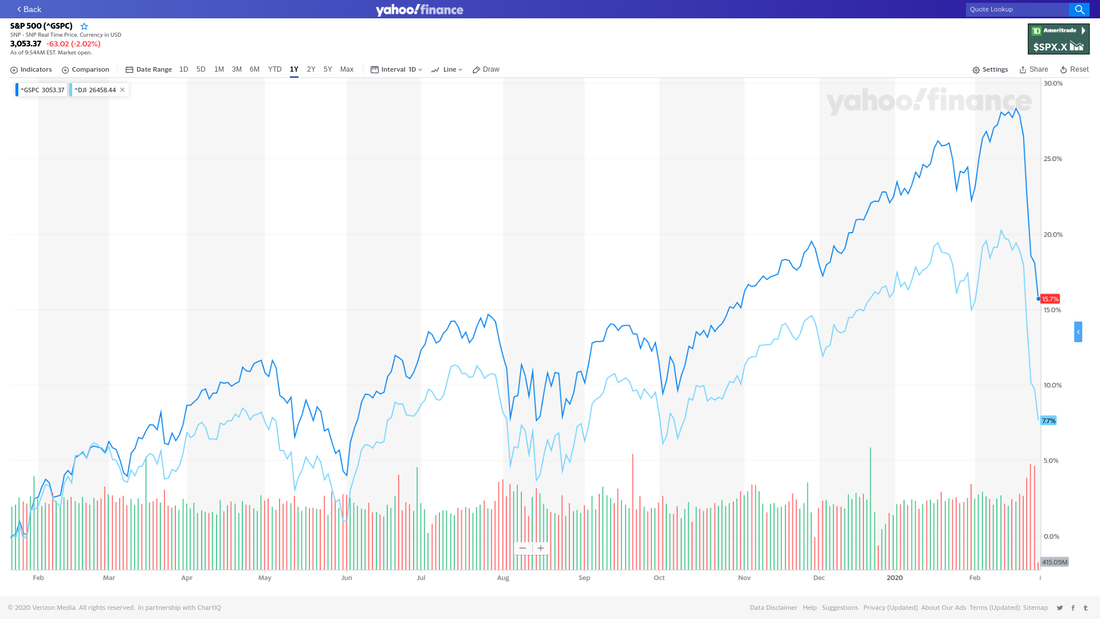 The numbers in the chart may be hard to read -- they show that current prices versus a year ago are still "up", with the Dow and S&P showing gains of 7.5% and 15.5% respectively for that period. The next image shows the price movement for two bond funds for the same period, one tracking a wide variety of bonds, and the other a tighter selection of US government bonds of intermediate term: 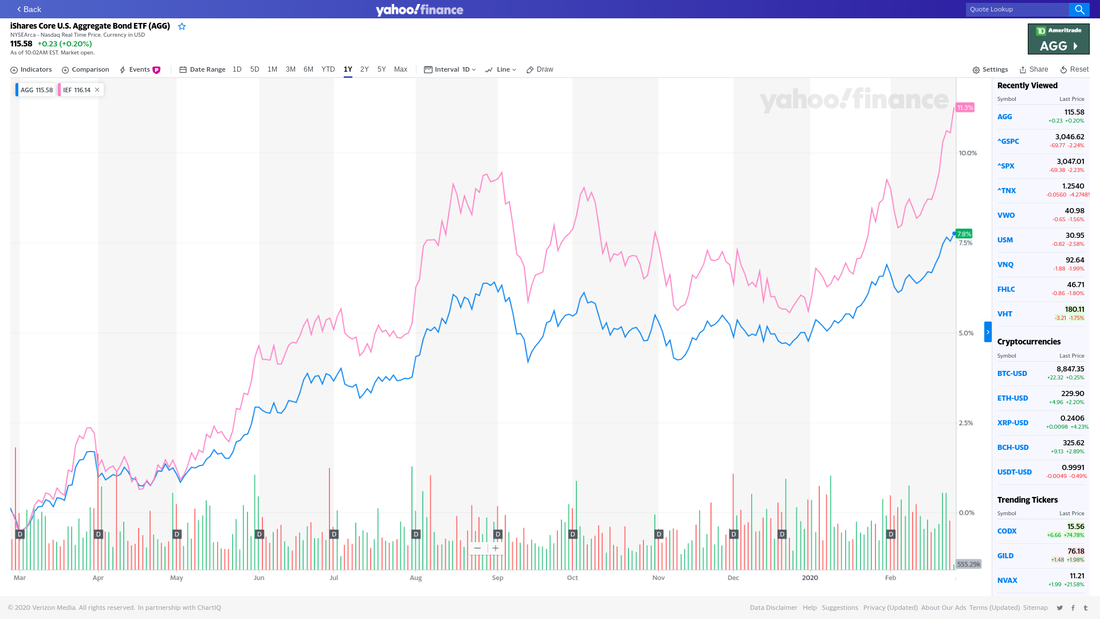 Those investments ALSO show significant gains for the period, and show the effects of a "flight to quality" i the last few days as the stock market volatility has ramped up. And speaking of volatility, here's a look at the VIX index, which represents one measure of market volatility: 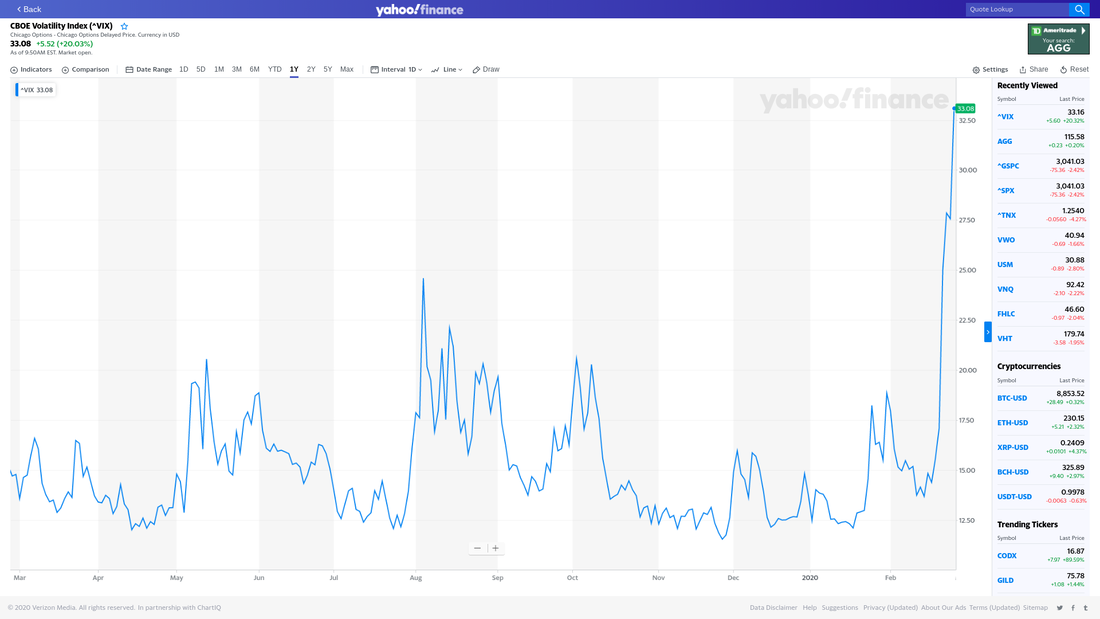 The recent spike is moderately higher than similar spikes in February and December of 2018, but still less than half the levels seen in 2008 during the "crisis". So, what's happening and what should investors do about it?I will continue to refrain from suggesting that I know with certainty the "why" of any given event in the markets, but I'm comfortable assuming that this activity has at least some source in the Coronavirus news. The value of any given stock relies implicitly on that company's likelihood of realizing profits, and the market trying to assign a "present value" to a future stream of those profits. When something happens to introduce increased uncertainty about those profits, the market reacts by widening their range of assumptions, and essentially by design tend to "overshoot" the estimates for how bad (or good) things may turn out.
Because this particular virus is "new", and we don't know precisely how widely it will spread and how disruptive the spread will be to different parts of the economy, large market participants are reacting by dramatically widening their math on future profits. When more information comes in, the market will likely tighten their assumptions again and the market will settle into a more stable range of prices; what we don't know is if that more stable range will be higher/lower/similar to where we were just before the virus hit. For my own investments, and those I manage for my clients, my intention is to maintain a risk appropriate posture; for goals with "long" time horizons, like retirement 10 or 20 or 30 years out, I will continue to hold portfolios weighted to stocks, with a smaller allocation to bonds, cash, etc. For shorter goals, I will continue to hold bonds, cash, and short term instruments in incrementally higher proportions to constrain the overall portfolio volatility. This week and next I will look for opportunities to tactically realize "tax losses" if they are valuable to my clients; I will review if specific index tracking funds performed as expected; I will use cash flows from dividends and interest to make tactical reinvestments; and I will rebalance portfolios that have drifted away from the client's designated plan. |
AuthorDavid R Wattenbarger, president of DRW Financial Archives
June 2022
Categories |
 RSS Feed
